Power BI
By IQMPowerBI is a business analytics service by Microsoft that provides interactive visualizations and business intelligence capabilities.
PowerBI is a business analytics service by Microsoft that provides interactive visualizations and business intelligence capabilities.
App Overview
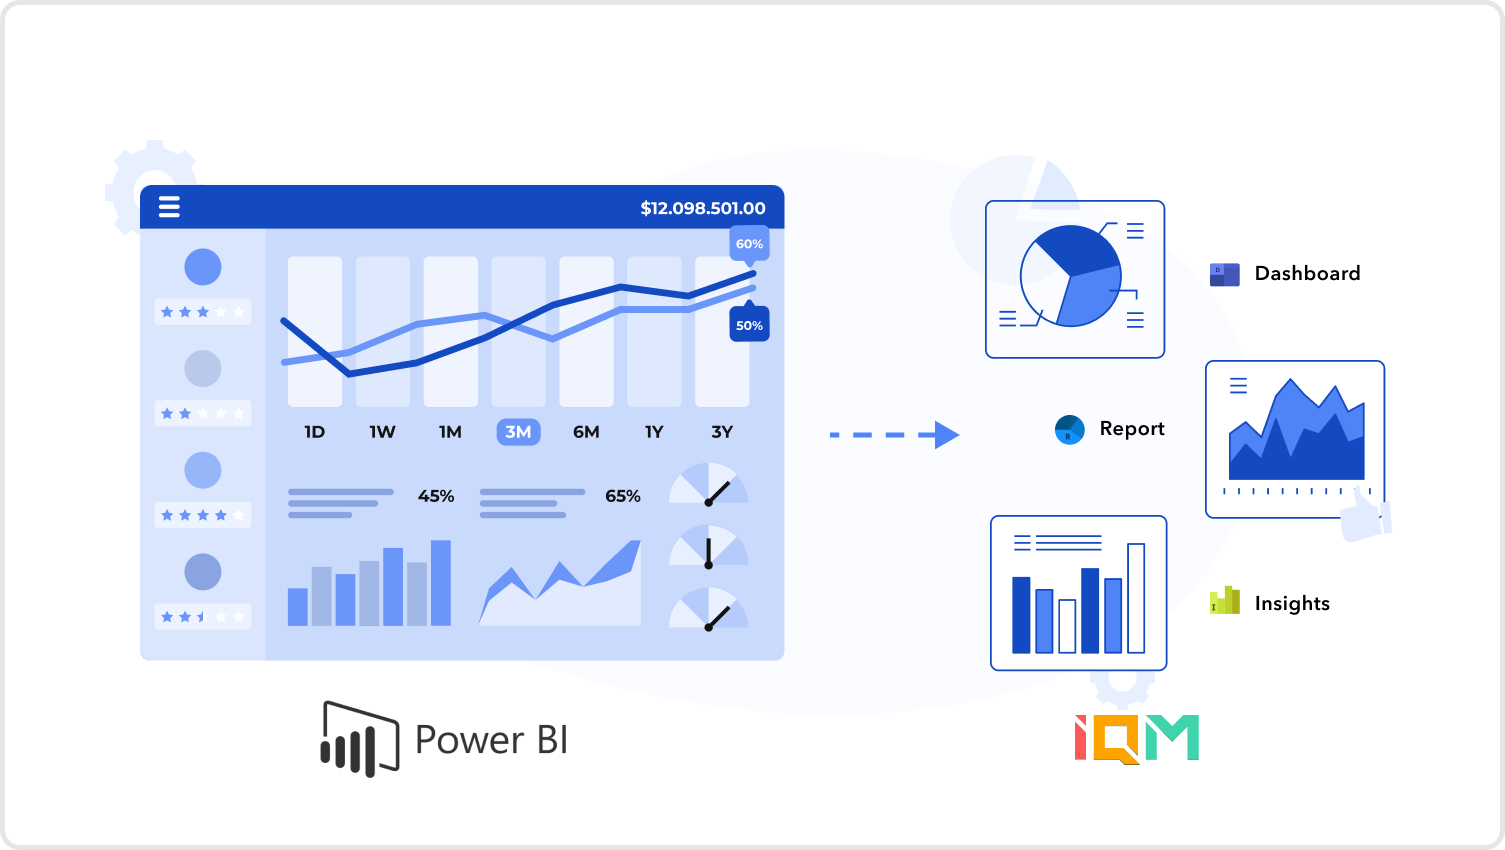
Microsoft Power BI is a data visualization and business intelligence software available for Windows. Power BI can be used to import data, create data models, and build visual reports using data from a variety of web and database connectors. By using the Power BI app on the IQM Marketplace, businesses can easily access their IQM Marketplace ad-serving data through the Power BI Desktop application. This data can then be transformed into visual reports that provide insights into the performance of their ad campaigns. With Power BI's powerful data modeling capabilities, businesses can also combine their IQM Marketplace ad-serving data with other data sources to gain even deeper insights into their ad performance. One of the main benefits of using the Power BI app on the IQM Marketplace is the ability to create customized dashboards and visual reports that can be shared with team members and stakeholders. These reports can be easily accessed through the Power BI service or embedded in other applications, such as SharePoint or Teams. Another benefit of using the Power BI app on the IQM Marketplace is the ability to create data-driven campaigns. By combining their IQM Marketplace ad-serving data with other data sources, businesses can gain insights into customer behavior and preferences, and use this information to create targeted and effective ad campaigns. Overall, the Power BI app on the IQM Marketplace is a powerful tool for businesses that are looking to gain insights into their ad performance and optimize their ad campaigns. By using this app, businesses can easily access their IQM Marketplace ad-serving data, transform it into visual reports, and make data-driven decisions that can lead to higher conversion rates and improved ROI.
Key Benefits
Customized Dashboards and Visual Reports
Using the Power BI app on the IQM Marketplace allows users to create customized dashboards and visual reports that can be shared with team members and stakeholders. These reports can be tailored to specific business needs, allowing users to highlight key metrics and KPIs that are most important to them. With interactive visualizations, users can easily drill down into data and gain insights that might have been missed with traditional tabular reports. Furthermore, these reports can be accessed through the Power BI service or embedded in other applications, such as SharePoint or Teams, making it easy for team members and stakeholders to access and stay informed.
Data Driven Campaigns
Another benefit of using the Power BI app on the IQM Marketplace is the ability to create data-driven campaigns. By combining their IQM Marketplace ad-serving data with other data sources, businesses can gain insights into customer behavior and preferences. This information can be used to create targeted and effective ad campaigns that resonate with their target audience. With Power BI, users can easily create reports and visualizations that highlight important customer insights, such as demographics, interests, and buying behaviors. These insights can be used to optimize ad campaigns, adjust targeting, and ultimately drive better results.
How Power BI works with IQM?
Connect Reporting Data Source
By integrating the PowerBI app with the IQM Marketplace platform, you can connect and consolidate reporting data from various sources and visualize it in a single, unified dashboard. This allows you to gain a comprehensive view of your marketing performance across channels and campaigns, and make data-driven decisions to optimize your marketing strategy. The PowerBI app on the IQM Marketplace platform then allows you to consolidate this data into a single, customizable dashboard that displays the metrics and KPIs that matter most to your business. You can choose from a wide range of visualization options, including tables, graphs, and charts, and create custom reports that can be shared with your team or clients.

Connect Reporting Data Source
With the PowerBI app on the IQM Marketplace platform, you can connect and consolidate data from multiple sources. You can then use BowerBI's powerful data visualization and analytics features to create custom reports and dashboards that display the metrics and KPIs that matter most to your business. PowerBI offers a wide range of visualization options, including tables, charts, graphs, and maps. You can also create custom visualizations and use PowerBI's drag-and-drop interface to explore your data and gain insights into your marketing performance. In addition to data visualization, the PowerBI app on the IQM Marketplace platform also offers powerful analytics features, including the ability to create calculated fields, use statistical models, and perform predictive analysis. These features can help you gain deeper insights into your marketing performance and make data-driven decisions to optimize your campaigns for success.

Requirements
PowerBI Account
IQM Marketplace Account
Resources
App Relevance
Verticals
Integration Details
Features
Affecting IQM apps
Reports
Contact
Email Address
support@iqm.com
Contact Number
1(212)476-5245
Data Privacy
You understand that when using this integration, it’s up to you to comply with applicable laws and regulations, as well as the AUP and Terms of Service. Please review this integration partner’s documentation for more information.
Pricing
This integration requires one of the following subscription plan.
Standard
Everything is free on this app. Enjoy!
Free
Free
Data & Permissions
Shared data
This shows how the data will flow between your app and IQM Marketplace
| IQM | Data Flow | Power BI |
|---|---|---|
Reports |  Power BI charts |
IQM Permissons
This app will require the following permissions on you account
| IQM |
|---|
View |


